One builder per territory. Yours.
Ranks every single-family house in your zips by how likely it is to be bought and rebuilt.
First release: nine Nashville zips, one builder each.
Alert email: 1 change on your lots in 37206
-
1900 block, 37206 Top 1%, number 1 in your list. 9,600 sq ft lot, 60 x 160 ft, R6, built 1951 The land is 67% of the assessed value: land $268,000, building $132,000.
- Land, 67%
- $268,000
- Building
- $132,000
Last sale 2018-06-14 for $212,000. No permit on this parcel since 2023.
- No historic or conservation overlay
- Not in a flood hazard area
- Lot split not indicated
-
1100 block, 37206 Top 1%, number 2 in your list. 10,200 sq ft lot, 60 x 170 ft, R6, built 1948 House built in 1948 (78 years old).
- Land, 61%
- $226,000
- Building
- $144,000
Last sale 2009-03-02 for $148,000. Latest permit: alteration, 2024-05-20.
- No historic or conservation overlay
- Not in a flood hazard area
- Lot split not indicated
-
800 block, 37206 Top 5%, number 3 in your list. 8,400 sq ft lot, 50 x 168 ft, R6, built 1955 Land assessed at $41 per sq ft, higher than 72% of single-family lots in Nashville.
- Land, 58%
- $344,000
- Building
- $249,000
Last sale 2015-09-30 for $175,000. No permit on this parcel since 2023.
- No historic or conservation overlay
- Not in a flood hazard area
- Lot split not indicated
See what any Nashville builder has torn down, and what is like it now
Type a builder's name as it appears on Metro permits. You get up to 50 of their most recent teardown-and-rebuild jobs, then the current lots in open zips that look like those jobs, by zip.
Covers builders with three or more rebuilds in Davidson County since June 2023. Zips another builder already holds show only as taken. Similar lots are a place to look, not a forecast: 24 of about 578 houses in our top 1 percent were torn down in the test window.
What you see
Layout only. No real builder or house.
What happens after you pick a zip
Pick your zip
The map shows which zips are open and which are taken. Pay once for the year: $597 for one zip or $1,497 for three.
Set your filter
Lot size, zoning, year built, land share, top assessed value. We start with the filters most infill builders use, and leave out multi-acre and estate-zoned lots until you ask for them.
Get the ranked list and the alerts
Each house comes with plain reasons ("the land is 67% of the assessed value", "house built in 1951"), the date of the data behind it, and a link to the county's own record. Email alerts arrive daily or weekly when something changes on a house inside your filter.
What a teardown looks like
An old house on a narrow lot comes down and a larger one goes up. These images are illustrations, not real addresses.
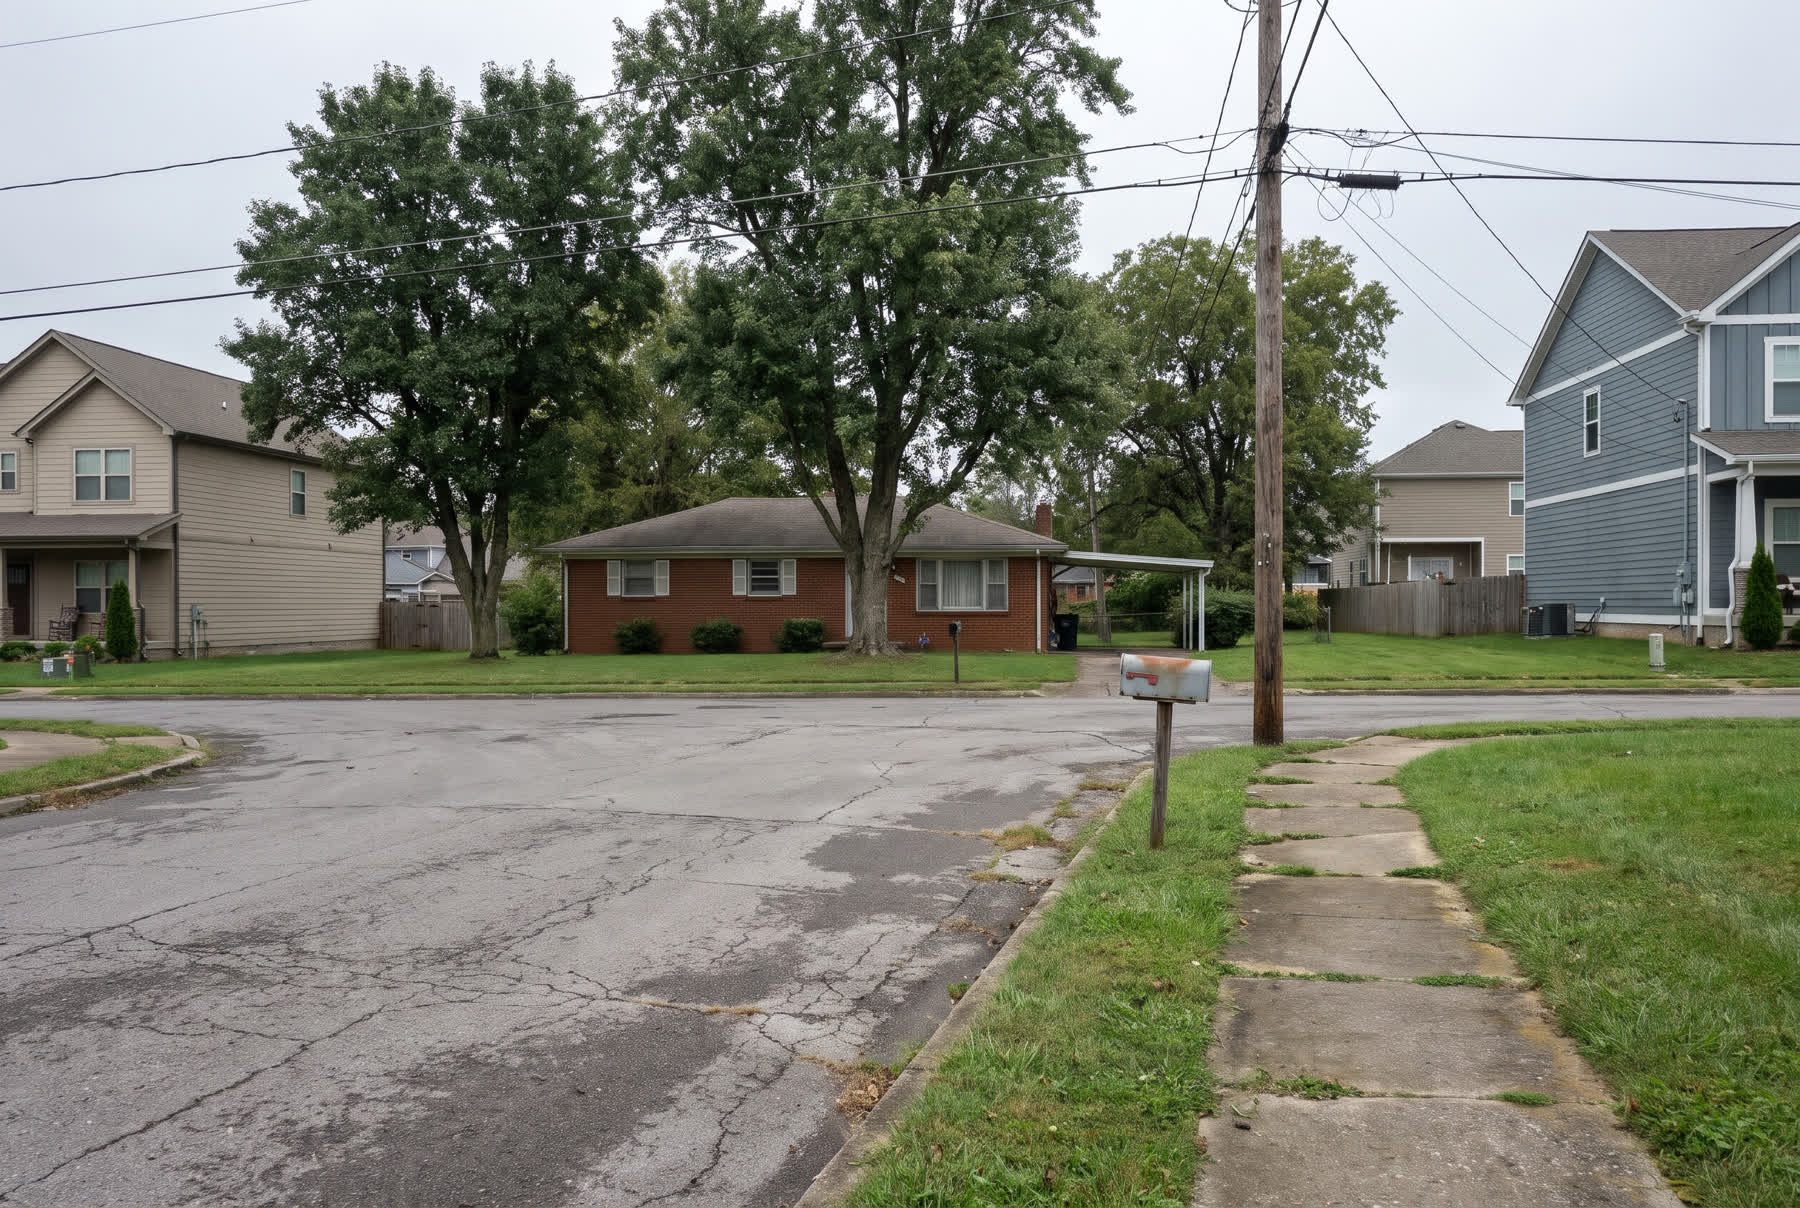
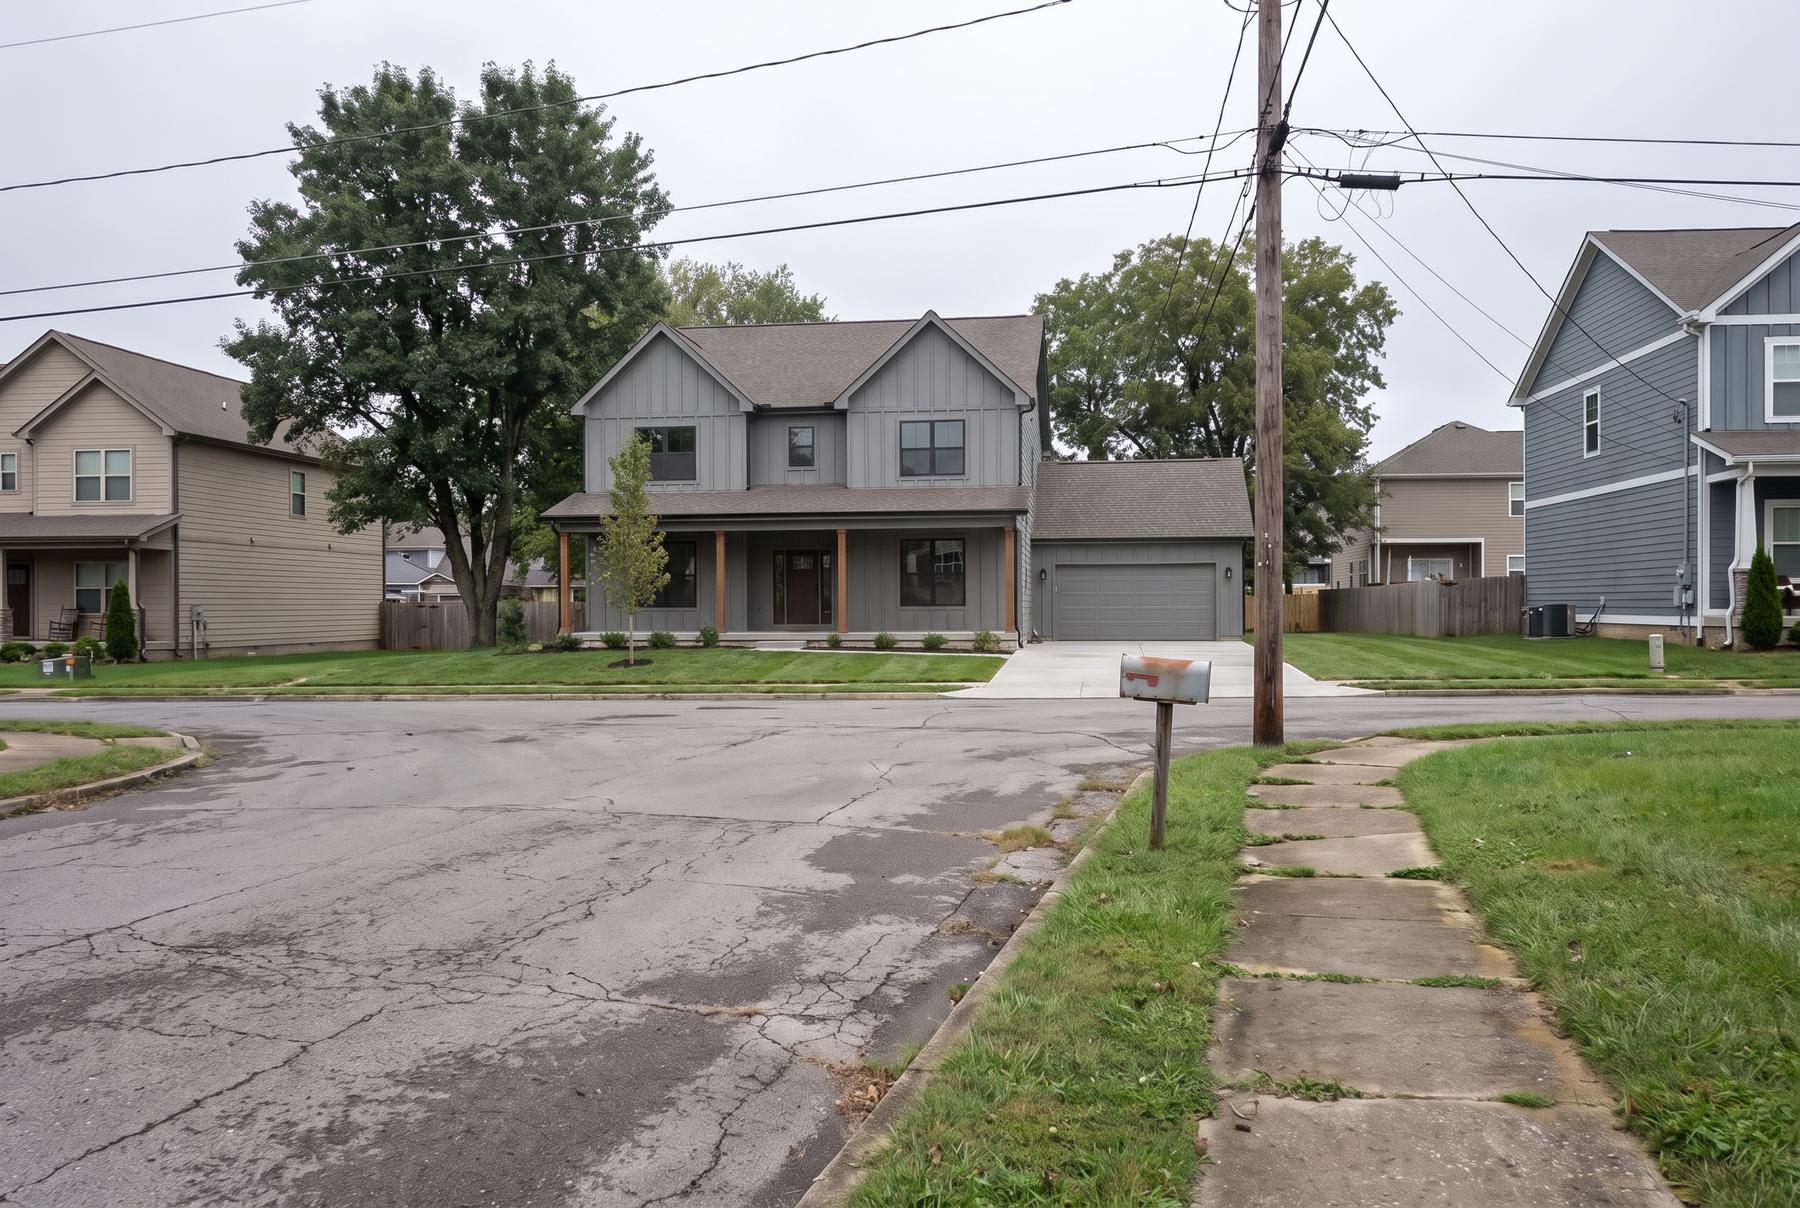 BeforeAfter
Tested on houses that came down after the score was built
We trained the score on older teardowns, then checked it on one later window, May 14 to November 13, 2026. 113 single-family houses in Davidson County were torn down in it, out of about 57,800 the score had not seen. It ranks houses by likelihood. It does not predict that any house will be torn down.
- 24 of 113 caught
Top 1 percent (about 578 houses)
21.1 times chanceChance gives 1.1. The simple age-and-land rule caught 7 (6.1 times). This one rests on 24 hits, so it has a wide margin: 14.0 to 29.0 times chance.
- 46 of 113 caught
Top 5 percent
8.1 times chanceChance gives 5.7. The simple age-and-land rule caught 27 (4.7 times).
- 68 of 113 caught
Top 10 percent
6.0 times chanceChance gives 11.3. The simple age-and-land rule caught 46 (4.0 times).
In plain terms
24 of about 578 houses in the top 1 percent were torn down in that window, a little over 4 percent. Most of what you see at the top will still be standing. The list is ranked by likelihood. It is not a prediction that any house will be torn down.
Measured November 17, 2026 on one time-split test window of past data. The score had no access to the May 14 to November 13, 2026 teardowns when it was trained. Area under the curve 0.878, against 0.823 for the simple rule.
Limits, next to the numbers
- One time-split window, May 14 to November 13, 2026. The top 1 percent figure rests on 24 hits, so its range is 14.0 to 29.0 times chance. Two earlier windows gave 15.8 and 16.1 times.
- The score was trained on 2024 property records and is applied to today's. House ages have drifted by about two and a half years.
- Sales reach the county file 2 to 4 weeks after closing. Parcels and sales run through November 3, 2026. We hide houses with a later sale, demolition or new-build permit we can see, but some sold or rebuilt houses will still show up.
- Tested on Nashville only. Nothing has been validated in any other city.
The simple rule, zoning and the permits
The obvious rule gets you a lot of the way, and we say so. A simple age-and-land rule caught 46 of the 113 in its top 10 percent, against 68 for the model. Where the model pulls ahead is the top 1 percent, 24 hits against 7, and that figure rests on few cases. The other thing we add is timing: we tell you when a house changes, and a rule does not.
Zoning accounts for much of the top 1 percent. Without the zoning feature its lift falls from 21.1 to 7.0 times chance, and 64 percent of today's top 1 percent sits in a one-acre zone that the default filter hides.
The permits are real too. We read 1,731 residential demolition permits issued in Davidson County from November 12, 2023 to November 13, 2026 and matched 63 percent of them to the new house built after, by parcel number, address and map location. That is how we know which builders are active, and where.
Full method and results: how the score works.
Which zips are open
The first release is nine Nashville zips. One builder holds each zip for a year, and nobody else gets the same list.
- 3720981 demolition permits, last 12 months Open
- 3720580 demolition permits, last 12 months Open
- 3720654 demolition permits, last 12 months Open
- 3720438 demolition permits, last 12 months Open
- 3720735 demolition permits, last 12 months Open
- 3721529 demolition permits, last 12 months Open
- 3721124 demolition permits, last 12 months Open
- 3721617 demolition permits, last 12 months Open
- 3721816 demolition permits, last 12 months Open
- 3721015 demolition permits, last 12 months Not offered
Zips are shaded by single-family houses with a demolition permit in the last 12 months. A pin means the zip is open. Zips with fewer than 15 such permits are left blank on purpose: there is too little data to say anything honest. Boundaries are Census ZIP Code Tabulation Areas, which approximate postal zips, so check your streets before you buy. No house-level data is shown on this site.
Permits through November 13, 2026. Counts come from Metro Nashville open data. All zip pages
Priced per zip, paid once for the year
One zip
$597 through December 9. $797 after.
One builder per zip, yours for 12 months
- The ranked list for your zip
- Your own filter
- Email alerts, daily or weekly
- The permit view of what other builders are tearing down
- The county record link and data date for every house
Three zips
$1,497 through December 9. $1,997 after.
Three zips, yours for 12 months. Saves $294 against three single zips.
- Everything in one zip, across three zips
- The permit view of what other builders are tearing down
- Paid up front by card
- Renewal is not automatic
First 30 days
If no alert inside your filter arrives in the first 30 days, you choose one: a swap to another open zip, an extension of your term, or your money back.
The number of alerts depends on how wide your filter is and how many houses change in your zip. We will set that number from real alert volume per zip before launch, and we will show it here.
These are the only two options, paid up front by card, and renewal is not automatic. Owner names, mailing addresses and phone numbers are not included. See the questions below.
Questions builders ask
What does it cost?
$597 for one zip, or $1,497 for three, for 12 months, paid up front by card. One builder holds each zip. There are no other packages, and renewal is not automatic.
One zip: $597 through December 9. $797 after. Three zips: $1,497 through December 9. $1,997 after.
I already know which houses are teardowns.
Good, you should. Our own test shows a simple rule built from age and land value caught 46 teardowns in its top 10 percent where the model caught 68, and a builder who works an area knows that rule by eye. What you do not have is every house in the zip, ranked, with a message when one changes. You also cannot easily see which builders pulled demolition permits last month in your zips.
If your list is already better than ours, you do not need us.
Where does the data come from?
County public records. For Nashville that is Metro Nashville open data: building and demolition permits, property standards (code) cases, planning applications, parcels, assessor values and zoning, plus the assessor's recent sales file. Every house links to the county's own record page.
Parcels, values and sales run through November 3, 2026, and permits through November 13, 2026. Sales reach the county file 2 to 4 weeks after closing, so a house that sold in the last month can still show as available. We hide anything with a later sale, demolition or new-build permit that we can see.
How accurate is it?
We trained the score on teardowns before a cutoff and tested it on the 113 houses torn down from May 14 to November 13, 2026, among about 57,800 single-family houses it had not seen. Its top 1 percent held 24 of them, its top 5 percent 46 and its top 10 percent 68. The simple age-and-land rule held 7, 27 and 46.
The list is ranked by likelihood. It is not a prediction that any house will be torn down: 24 of about 578 houses in the top 1 percent came down in that window, a little over 4 percent, so most of what you see at the top will still be standing. The top 1 percent figure rests on only 24 hits, and its range is 14.0 to 29.0 times chance. One test window, Davidson County only, measured November 17, 2026.
What does exclusive mean?
While you hold a zip, we do not sell it to anyone else, and the map shows it as taken. The term is 12 months from payment. We cannot stop another builder from finding houses by other means, and we do not promise you will win any house.
Do you give me the owner’s name or phone number?
No. We do not store or sell owner names, mailing addresses or phone numbers, and the score uses nothing about the owner’s age, family or health. You get the house, the reasons it ranked, and a link to the county record.
How you contact an owner is up to you. Do-not-call rules and Tennessee’s disclosure rules for buying houses apply to you. Our notice on this is a draft that a lawyer has not yet read.
Are the zip boundaries exact?
No. The maps use Census ZIP Code Tabulation Areas, which approximate postal zips and can differ from the way the post office draws them. Check the map for your streets before you buy. A territory is stored as an explicit list of parcels, so what you hold is clear.
What if too few houses match my filter?
If no alert inside your filter arrives in the first 30 days, you choose one: a swap to another open zip, an extension of your term, or your money back.
One builder per territory. Yours.
Check whether your zip is still open. Nothing is charged to look.
Check a zip